— CAPABILITYAsset-level tracking
→
— BUSINESS IMPACT—62%leakageReplacement cost drops proportionally. For a 10K-unit pool, that's ~€12K/yr saved.
Reusable packaging without tracking is just slower cardboard. Our platform turns every Packio unit into an addressable asset — tracked, measured, exported, and decided on. Not a feature. An infrastructure layer.
Reusable packaging doesn't automatically mean visibility. Here's what happens inside operations when assets become addressable.
Nobody knows how many boxes are actually in circulation vs. warehouse.
"Most come back" isn't a metric. It's a hope. CFOs can't approve "hope".
Annual CO₂ estimates built from spend data. CSRD auditors don't love that.
Assets disappear silently. By the time someone notices, the pool is 40% smaller.
Compliance team pulls Excel files from 4 systems and hopes numbers match.
Know exactly how many units are in-transit, in-hand, in-warehouse — by location, by SKU.
Measured per route, per SKU, per period. Alertable when it dips. Actionable.
CSRD-formatted CO₂, waste avoided, water savings. Audit-ready. Auditor-friendly.
Alert triggers when assets miss expected scan windows. Find them before they're gone.
Regulator asks for reuse data? Export. Done. Every cycle documented with timestamps.
Real-time KPIs, historical charts, and exportable reports — built for operators, not for demos.
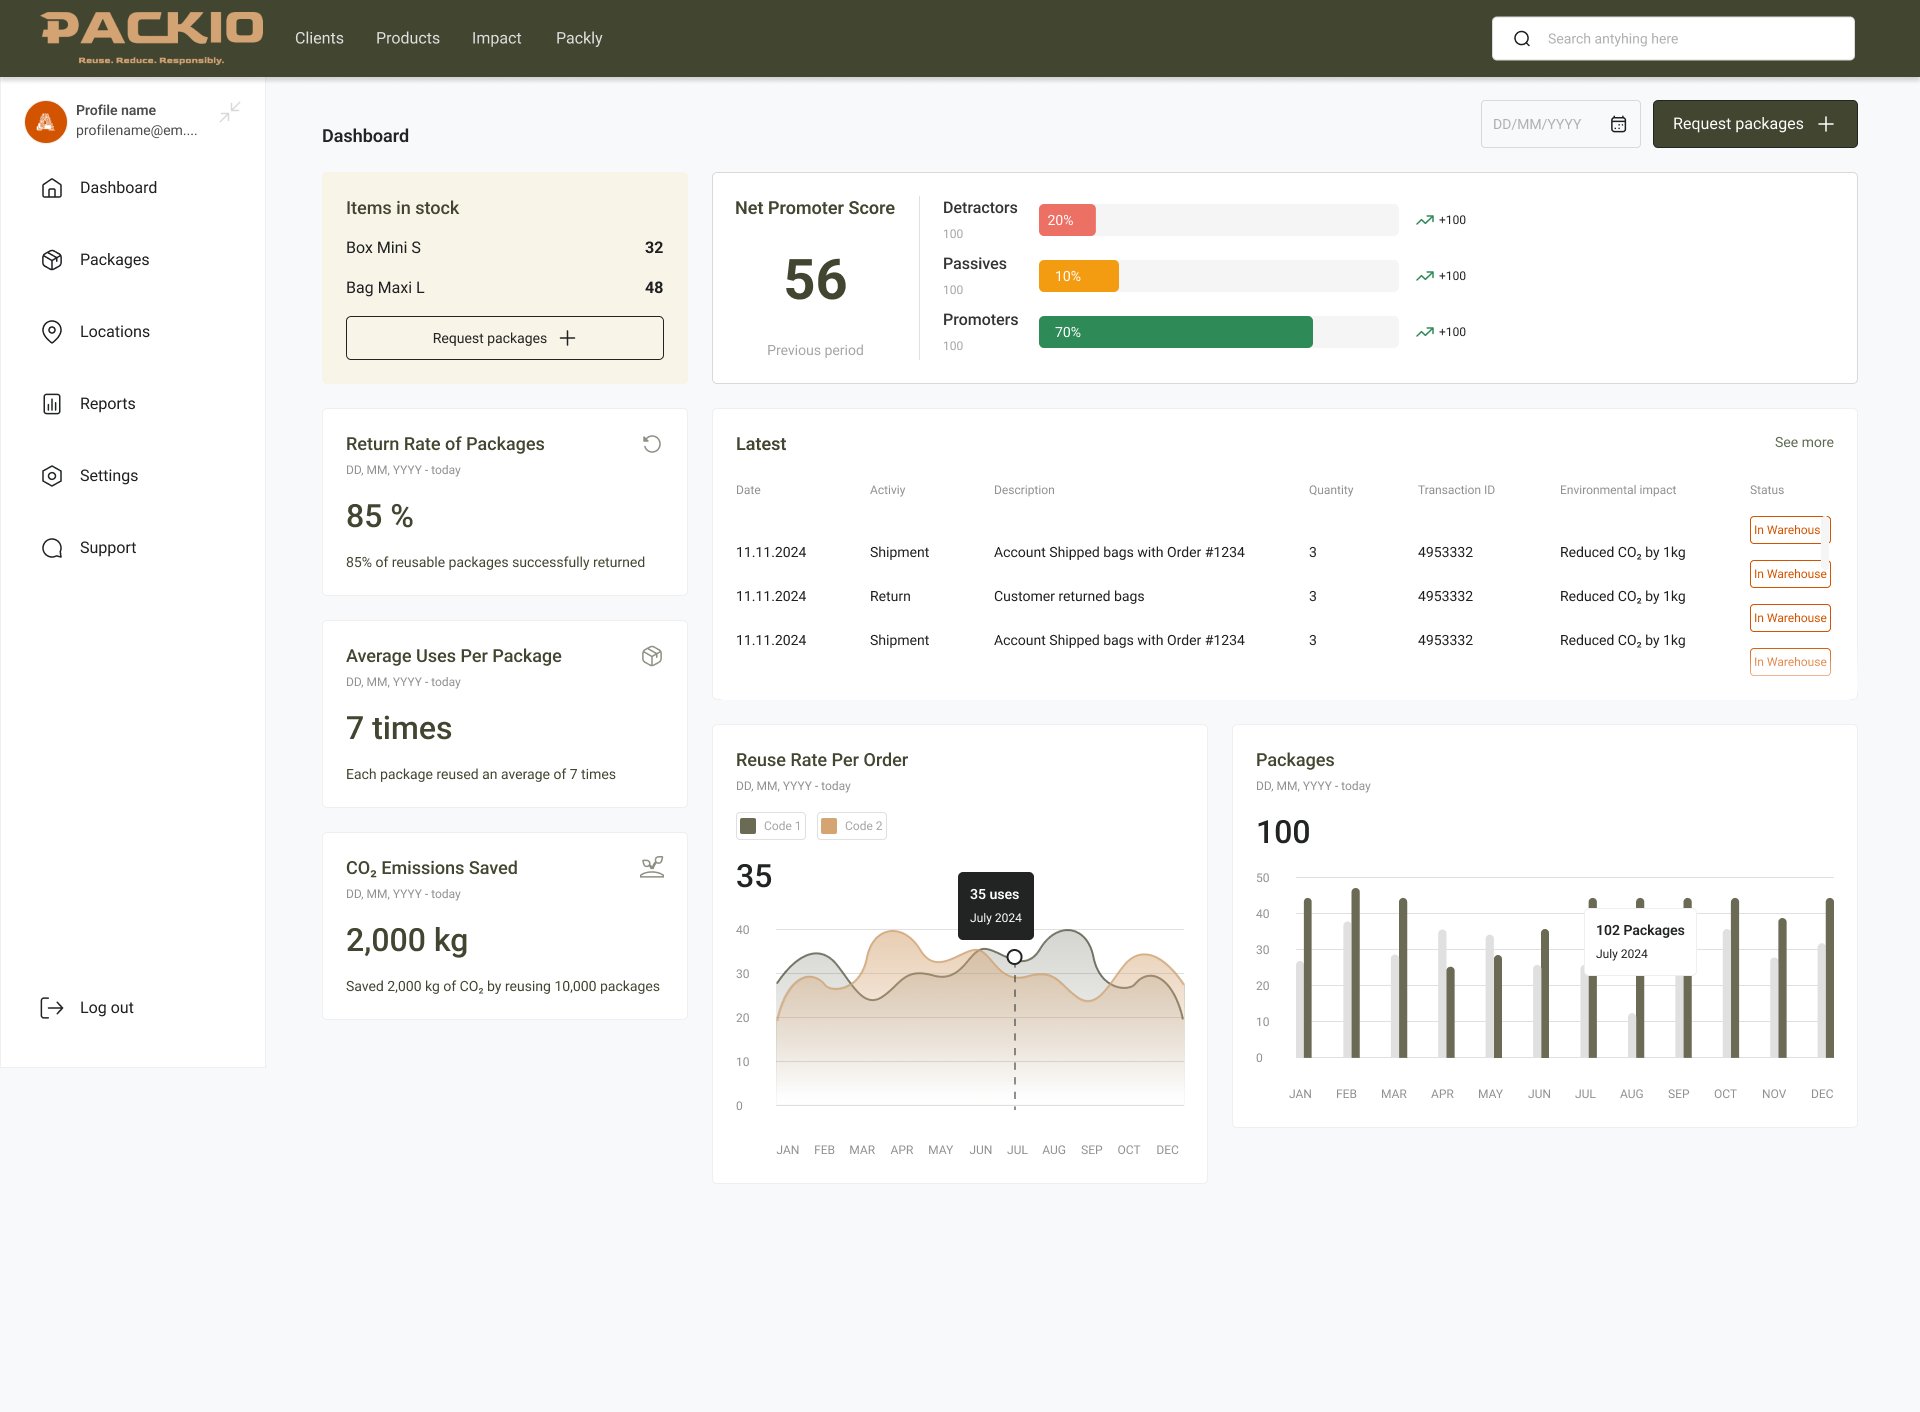
Tracking reusable assets isn't a dashboard vanity metric. Every capability below has a direct, measurable line-item impact on your P&L.
We don't publish anonymized customer quotes. When our pilot brands consent to share specific operational outcomes, attributed quotes and case studies will appear here with their names.
A dashboard is only useful if it changes decisions. Here are 6 questions your operations team can finally answer with real data.
See per-cycle cost trending against lease fees. If circulation stabilizes, convert capex. If variable, stay on opex.
Filter return rate by drop-off region, route, SKU. Find the 2–3 routes dragging the average down. Fix or redesign.
Per-shipment CO₂ calculated from real data — not estimates. Filter by time period, brand, SKU. Export for CSRD.
Circulation forecast based on daily shipment growth, seasonality, and attrition. Stock alerts before you run out.
Packaging cost per shipment, trending month over month. Share with investors. Include in annual report.
Customer NPS collected at drop-off. See which brands' customers love reuse most. Double down on those.
Every layer measured, logged, and exportable. Every feature has an API. Every metric has an alert.
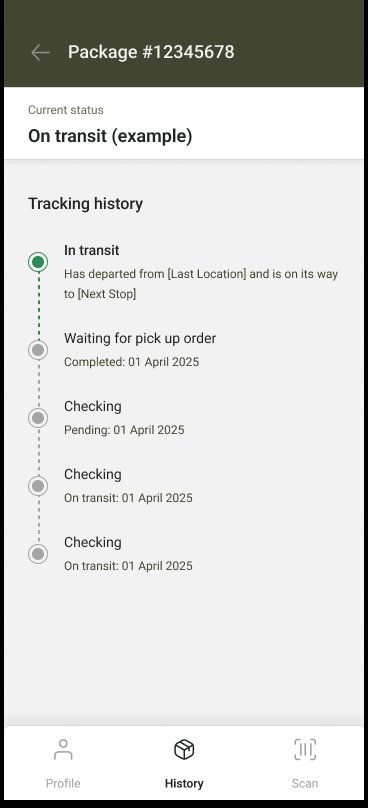
Every QR scan creates an event. Full chain of custody from production → retirement. Every unit, every cycle.
Pre-formatted export templates for major ESG frameworks. Monthly, quarterly, annual. Auditor-ready.
Ops, finance, sustainability, CS — each team sees what they need. Admin controls who sees what.
◆ Live Documented REST endpoints and HMAC-signed webhooks.
◌ Roadmap · 2026–2027 Native connectors for SoftOne, EpsiloNet, SAP.
Return rate dips, leakage windows, inventory thresholds, NPS changes. Triggered per your rules.
Historical trend analysis and reorder forecasting based on your operation's patterns — to flag when to expand your pool before you run out. In active development; planned for Q2 2027.
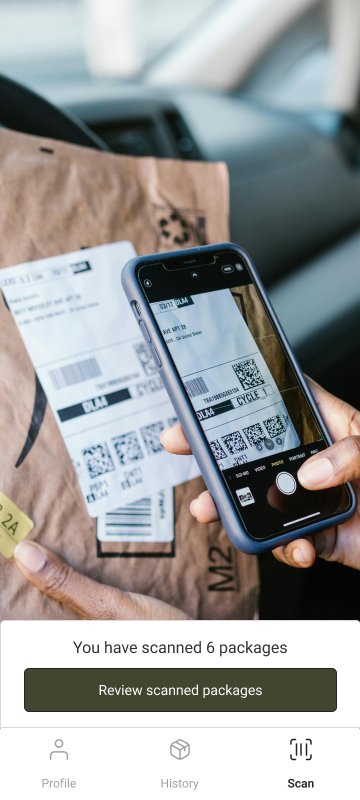
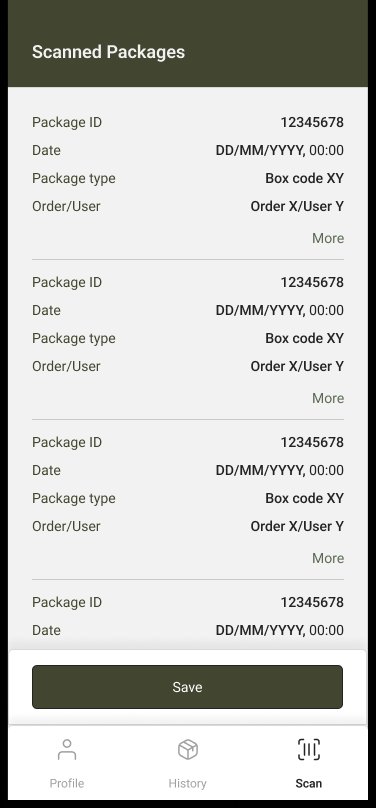
For warehouse and operations teams scanning packages on the line. Designed for the picker workflow — point camera, scan QR, batch review, sync. Works without a WMS. The app is in active development; screenshots below show current build, with public launch planned alongside the platform's 2027 e-commerce rollout.
Book a platform demo with our team. We'll show you the dashboard live, populated with our representative test data, and walk you through how it would map to your operation. No mocked-up customer data, no theatre — just an honest tour.
Book a demo→